


When creating a newsletter, the newsletter creation tool often gives you the option to analyze the newsletter's performance using reports. These reports contain a lot of numbers and statistics, and it is often difficult to know what to make of them. Which figures are good and which are rather poor? How can you use the statistics to make your next newsletter more appealing?
To answer these questions, let's first take a look at which metrics we can actually obtain and how they are calculated. To do this, we will first look at the basic overview of a report in CleverReach, a newsletter software solution that we use in our web agency.
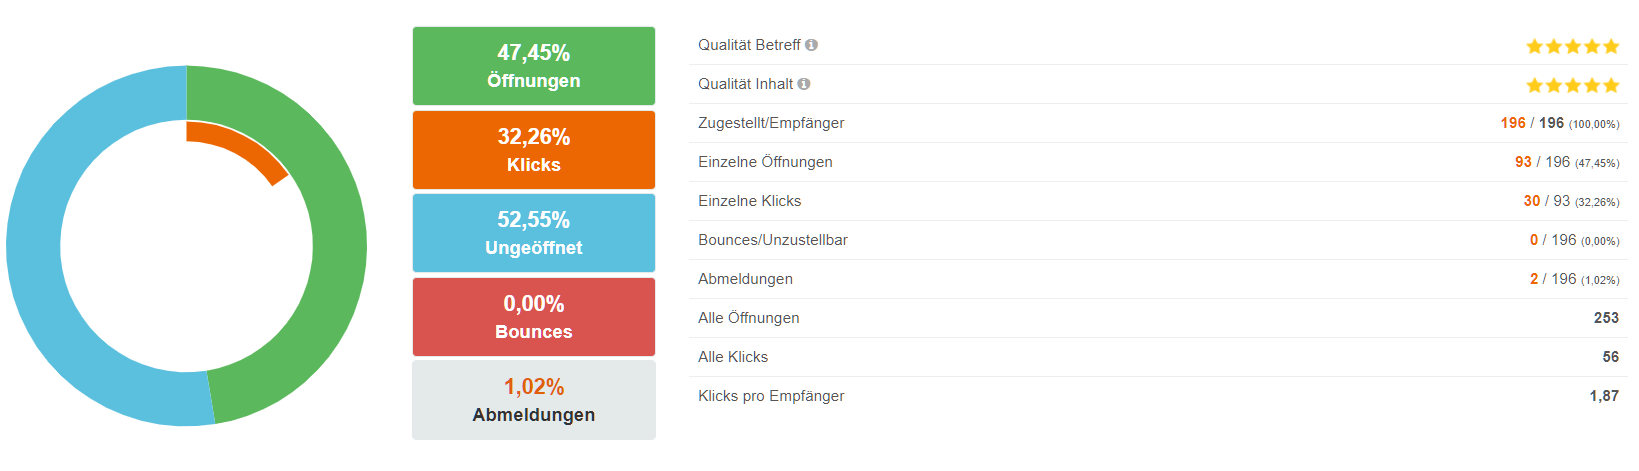
If you selected the option to receive a report when sending the newsletter, you will receive insights into the open rate, click rate, bounce rate, and unsubscribe rate. These are the typical metrics provided by newsletter software in a report. Next, let's take a closer look at what exactly these figures mean.
The benchmark values given below are taken from the "Email Marketing Benchmark 2020" study by Episerver and are from the "All Industries" category unless otherwise stated. For this email marketing study, around 7.8 billion emails from approximately 150 companies across various industries were analyzed. The emails were sent between January 1, 2019, and December 31, 2019. The number of recipients varied depending on the industry and company.
Open Rate
The open rate is often divided into unique and absolute open rates.
The unique open rate measures the number of recorded opens in relation to successfully delivered emails. However, each email opening is counted only once. According to the study, this open rate averages 29%. Interestingly, for smaller recipient lists (<2,500), the average is as high as 34%.
The absolute open rate shows the total number of recorded opens in relation to the number of delivered emails. The value can theoretically exceed 100% because multiple opens of the same email are also recorded. This open rate averages 60%. For fewer than 2,500 recipients, it is even close to 80%.
This shows that the open rate tends to be higher when the distribution list is smaller.
Click Rate
The click rate is also divided into unique and absolute click rates.
The unique click rate indicates how many external links in the email were clicked, again in relation to successfully delivered emails. Just as with the unique open rate, each click per email is counted only once. The average value in the study is 4.8%, and for recipient lists with fewer than 2,500 recipients, it is as high as 6.5%.
The absolute click rate compares the total number of clicks on external links within the email with the number of successfully delivered emails. The difference from the unique click rate is that multiple clicks can be counted, just as with the absolute open rate. The average value across all industries is 8.1%.
Bounce Rate
The bounce rate is also divided into two variants: the so-called hard bounce rate and soft bounce rate. Both should be kept as low as possible and ideally be close to 0%.
With the hard bounce rate, the email could not be delivered due to a permanent error. The most common reason is that the associated email account no longer exists. The average hard bounce rate is 0.25%.
The soft bounce rate averages 0.21%. The difference from the hard bounce rate is that the email could initially only not be delivered temporarily. Possible reasons include an overloaded or malfunctioning mail server or a full inbox.
In most cases, soft-bounce email addresses are automatically removed from the recipient list by sending systems after 5 failed delivery attempts, while hard-bounce email addresses are removed after 3 failed attempts.
Unsubscribe Rate
The unsubscribe rate indicates how many readers unsubscribe from a newsletter. Unfortunately, this is normal and unavoidable. Possible reasons for unsubscribing include a simple change in the reader's interests or changes in their personal circumstances.
According to the Episerver study, the average unsubscribe rate across all industries is 0.1%.
Conclusion
These explanations and figures are intended only as guidelines and can help with the analysis and evaluation of a newsletter. However, it is important to remember that every newsletter is different and that every industry has its own characteristics.
In general, it helps to formulate the subject line as concisely and interestingly as possible in order to arouse the readers' curiosity. This can potentially increase the open rate. If the newsletter sounds interesting, readers are more likely to want to learn more about the topic.
The click rate can provide insights into the content and/or design of the newsletter. If the click rate is high, the newsletter was interesting and relevant to the reader. With a low click rate, the reader may either not have been interested or the layout may have been poorly designed, meaning that the reader may not have recognized that there was an external link or may not have reached it in the first place.
In general, you should not judge the success of a newsletter based on a single statistic. Instead, it is much more useful to look at how the metrics of your own newsletters develop over a longer period. This provides considerably more meaningful insights, as it allows you to evaluate the success of an individual email based on your own circumstances and compare it with other newsletters you have sent.
For example, if the click rate is unusually low, this may indicate that the layout was not quite optimal this time. Conversely, an unusually high open rate may indicate a particularly well-formulated subject line or a particularly relevant topic.
Do you have any questions about this topic? Or would you like to create your own website or online shop with a newsletter? Then feel free to contact us!